KPI of the Week: Mastering the CALCULATE DAX Measure for Custom Sales Metrics
- mmykkanen
- Jun 9
- 2 min read

In Power BI, the CALCULATE function is the core engine behind almost every meaningful KPI. It allows you to redefine how a measure behaves by modifying the filter context in which it is evaluated. When paired with functions like SUM and logical expressions inside FILTER, CALCULATE becomes a flexible tool for building accurate, consistent sales metrics that respond intelligently to slicers, dates, categories, and other report interactions.
The Core Pattern: CALCULATE + SUM + FILTER

At its simplest, CALCULATE takes an expression—often a SUM of a numeric column—and evaluates it under a new set of conditions. This is where FILTER comes in. FILTER allows you to specify exactly which rows should be included in the calculation, giving you precise control over how your KPI behaves. For example, you might use FILTER to include only rows where the sales amount is greater than zero, or to restrict the calculation to a specific product category, region, or time period. SUM then aggregates the values from the rows that pass through the filter, producing a clean, governed result.
What makes this pattern so powerful is that it creates KPIs that behave consistently across your entire reporting environment. Instead of relying on visuals or slicers to do the heavy lifting, CALCULATE ensures that your business logic is embedded directly into the measure itself. This means your sales KPIs will always follow the same rules, no matter where they appear or how users interact with the report.
Example: Total Sales

Using CALCULATE with SUM and FILTER also helps eliminate common reporting issues, such as mismatched totals, inconsistent logic across dashboards, or KPIs that break when additional filters are applied. By defining your logic explicitly, you create measures that are both reliable and scalable. This is especially important when your organization begins layering on more advanced analytics, such as forecasting, segmentation, or profitability modeling. Clean, consistent KPIs are the foundation for all of it.
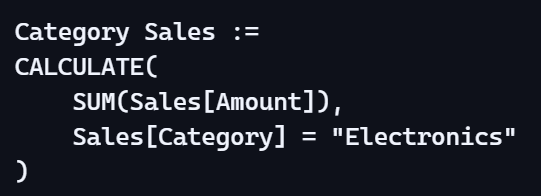
Example: Sales for a Specific Category
Example: Sales for the Current Year

This week’s focus on the CALCULATE DAX measure sets the stage for more advanced KPI patterns we’ll explore in future posts. Time‑intelligence calculations, customer segmentation metrics, margin and profitability KPIs, and even scenario‑planning measures all build on the same structure you learned here. Once you understand how CALCULATE reshapes context—and how FILTER and SUM help you refine that context—you unlock the ability to create almost any business metric your organization needs.
Next week, we’ll build on this foundation by exploring how CALCULATE interacts with date intelligence, and how you can use it to create KPIs like month‑to‑date, year‑to‑date, and year‑over‑year comparisons. These measures are essential for understanding performance trends and will help you move from simple reporting into true business analytics.


Comments